Our interest in the measurement of air and water flow is timeless. Knowledge of the direction and velocity of air flow was essential information for all ancient navigators, and the ability to measure water flow was necessary for the fair distribution of water through the aqueducts of such early communities as the Sumerian cities of Ur, Kish, and Mari near the Tigris and Euphrates Rivers around 5,000 B.C. Even today, the distribution of water among the rice patties of Bali is the sacred duty of authorities designated the “Water Priests.”
Our understanding of the behavior of liquids and gases (including hydrodynamics, pneumatics, aerodynamics) is based on the works of the ancient Greek scientists Aristotle and Archimedes. In the Aristotelian view, motion involves a medium that rushes in behind a body to prevent a vacuum. In the sixth century A.D., John Philoponos suggested that a body in motion acquired a property called impetus, and that the body came to rest when its impetus died out.
In 1687, the English mathematician Sir Isaac Newton discovered the law of universal gravitation. The operation of angular momentum-type mass flow meters is based directly on Newton’s second law of angular motion. In 1742, the French mathematician Rond d’Alembert proved that Newton’s third law of motion applies not only to stationary bodies, but also to objects in motion.
The Flow Pioneers
A major milestone in the understanding of flow was reached in 1783 when the Swiss physicist Daniel Bernoulli published his Hydrodynamica. In it, he introduced the concept of the conservation of energy for fluid flows. Bernoulli determined that an increase in the velocity of a flowing fluid increases its kinetic energy while decreasing its static energy. It is for this reason that a flow restriction causes an increase in the flowing velocity and also causes a drop in the static pressure of the flowing fluid.
The permanent pressure loss through a flow meter is expressed either as a percentage of the total pressure drop or in units of velocity heads, calculated as V2/2g, where V is the flowing and g is the gravitational acceleration (32.2 feet/second2 or 9.8 meters/second2 at 60o latitude). For example, if the velocity of a flowing fluid is 10 ft/s, the velocity head is 100/64.4 = 1.55 ft. If the fluid is water, the velocity head corresponds to 1.55 ft of water (or 0.67 psi). If the fluid is air, then the velocity head corresponds to the weight of a 1.55-ft column of air.
The permanent pressure loss through various flow elements can be expressed as a percentage of the total pressure drop (Figure 1), or it can be expressed in terms of velocity heads. The permanent pressure loss through an orifice is four velocity heads; through a vortex shedding sensor, it is two; through positive displacement and turbine meters, about one; and, through flow venturis, less than 0.5 heads. Therefore, if an orifice plate (Figure 2) with a beta ratio of 0.3 (diameter of the orifice to that of the pipe) has an unrecovered pressure loss of 100 in H2O, a venturi flow tube could reduce that pressure loss to about 12 in H2O for the same measurement.
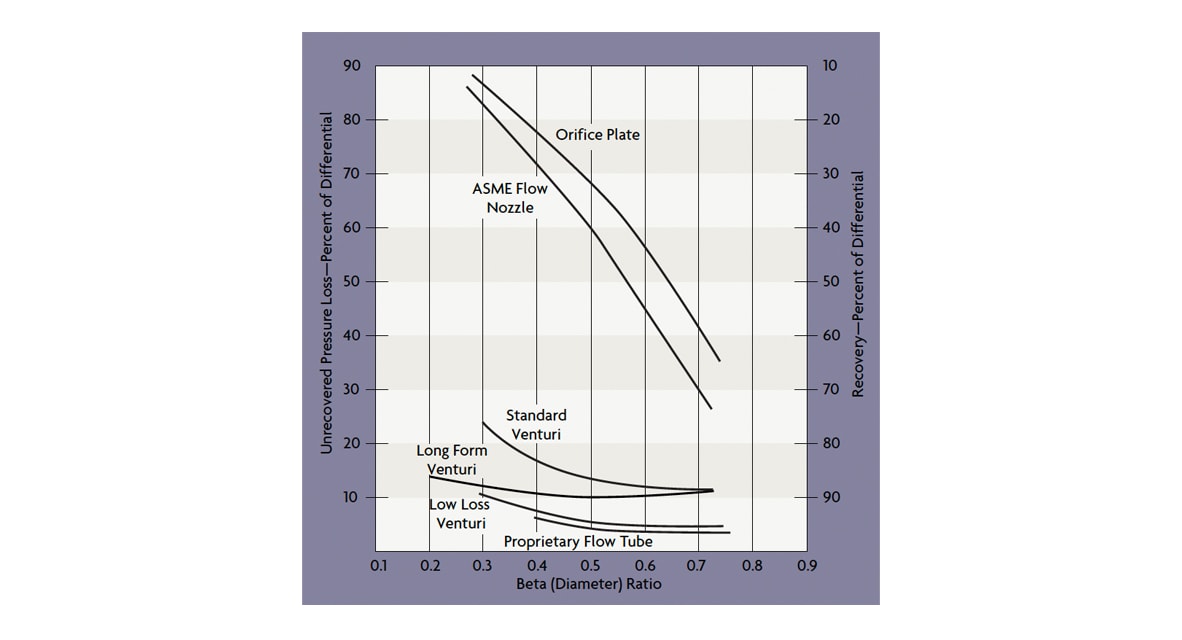 Figure 1: Pressure Loss-Venturi vs. Orifice
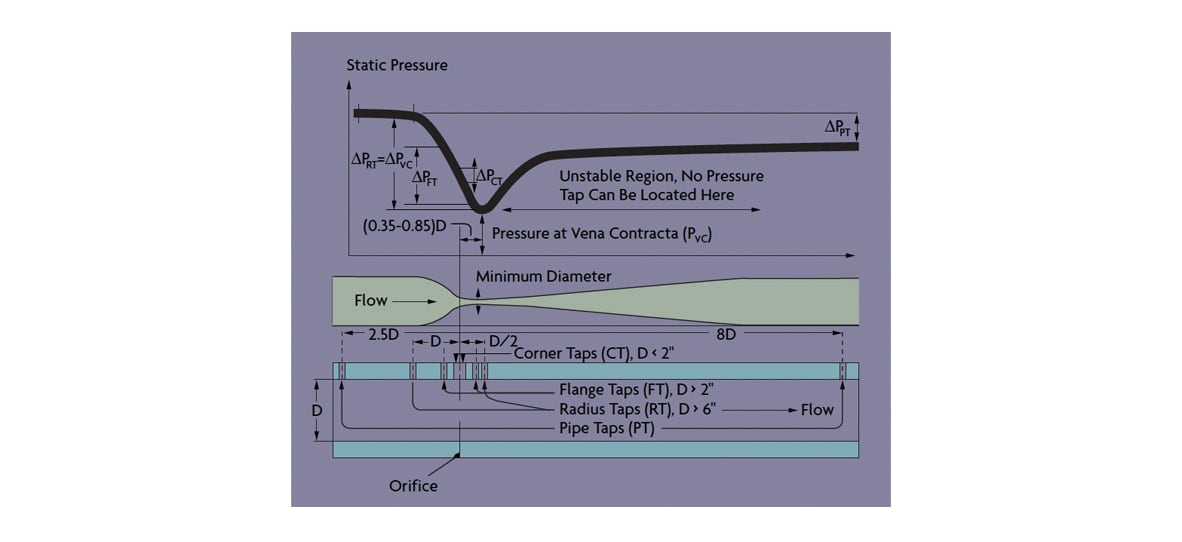 Figure 2: Conversion of Static Pressure Into Kinetic Energy
In 1831, the English scientist Michael Faraday discovered the dynamo when he noted that, if a copper disk is rotated between the poles of a permanent magnet, electric current is generated. Faraday’s law of electromagnetic induction is the basis for the operation of the magnetic flow meter. As shown in Figure 3, when a liquid conductor moves in a pipe having a diameter (D) and travels with an average velocity (V) through a magnetic field of B intensity, it will introduce a voltage (E) according to the relationship:
E = BVDC
Where C is the constant for units conversion.
 Figure 3: Faraday’s Law Is the Basis of the Magnetic Flow Meter
Over the past several years, the performance of Electromagnetic flow meters has improved significantly. Among the advances are probe and ceramic insert designs and the use of pulsed magnetic fields (Figure 4), but the basic operating principle of Faraday’s law of electric induction has not changed.
 Figure 4: Magmeter Accuracy
In 1883, the British mechanical engineer Osborne Reynolds proposed a single, dimensionless ratio to describe the velocity profile of flowing fluids:
Re = DVƿ/µ
Where D is the pipe diameter, V is the fluid velocity, ƿ is the fluid density, and µ is the fluid viscosity.
He noted that, at low Reynolds numbers (below 2,000) (Figure 5), flow is dominated by viscous forces and the velocity profile is (elongated) parabolic. At high Reynolds numbers (above 20,000), the flow is dominated by internal forces, resulting in a more uniform axial velocity across the flowing stream and a flat velocity profile.
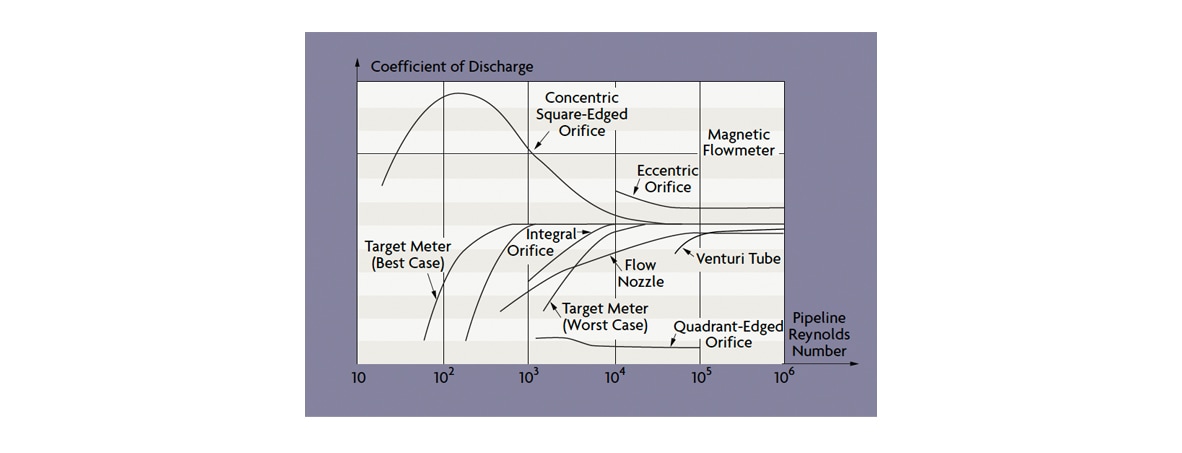 Figure 5: Effect of Reynolds Numbers on Various Flow Meters
Until 1970 or so, it was believed that the transition between laminar and turbulent flows is gradual, but increased understanding of turbulence through supercomputer modeling has shown that the onset of turbulence is abrupt.
When flow is turbulent, the pressure drop through a restriction is proportional to the square of the flowrate. Therefore, flow can be measured by takin the square root o a differential pressure cell output. When the flow is laminar, a linear relationship exists between flow and pressure drop. Laminar flow meters are used at very low flowrates (capillary flow meters) or when the viscosity of the process fluid is high.
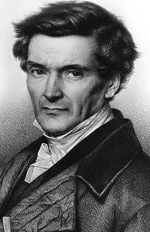 Gaspard Coriolis
In the case of some flow meters technologies, more than a century elapsed between the discovery of a scientific principle and its use in building a flow meter. This is the case with both the Doppler ultrasonic and the Coriolis meter.
In 1842, the Austrian physicist Christian Doppler discovered that, if a sound source is approaching a receiver (such as a train moving toward a stationary listener), the frequency of the sound will appear higher. If the source and the recipient are moving away from each other, the pitch will drop (the wavelength of the sound will appear to decrease). Yet it was more than a century later that the first ultrasonic Doppler flow meter came on the market. It projected a 0.5-MHz beam into a flowing stream containing reflectors such as bubbles or particles. The shift in the reflected frequency was a function of the average traveling velocity of the reflectors. This speed, in turn, could be used to calculate a flowrate.
The history of the Coriolis flow meter is similar. The French civil engineer Gaspard Coriolis discovered in 1843 that the wind, the ocean currents, and even airborne artillery shells will all drift sideways because of the earth’s rotation. In the northern hemisphere, the deflection is to the right of the motion; in the southern hemisphere, it is to the left. Similarly, a body traveling toward either pole will veer eastward, because it retains the greater eastward rotational speed of the lower altitudes as it passes over the more slowly rotating earth surface near the poles. Again, it was the slow evolution of sensors and electronics that delayed creation of the first commercial Coriolis mass flow meter until the 1970’s.
It was the Hungarian-American aeronautical engineer Theodore von Karman who, as a child growing up in Transylvania (now Romania), noticed that stationary rocks caused vortices in flowing water, and that the distances between these traveling vortices are constant, no matter how fast or slow the water runs. Later in life, he also observed that, when a flag flutters in the wind, the wavelength of the flutter is independent of the wind velocity and depends solely on the diameter of the flagpole. This is the theory behind the vortex flow meter, which determines flow velocity by counting the number of vortices passing a sensor. Von Karman published his finding in 1954, and because by that time the sensors and electronics required to count vortices were already in existence, the first edition of the Instrument Engineers’ Handbook in 1968 was able to report the availability of the first swirl meter.
The computer has opened new frontiers in all fields of engineering, and flow measurement is no exception. It was only as long ago as 1954 that another Hungarian-American mathematician, John Von Neumann, built Uniac – and even more recently that yet another Hungarian-American, Andy Grove of Intel, developed the integrated circuit. Yet these events are already changing the field of flow metering. Intelligent differential pressure cells, for example, can automatically switch their range between two calibrated spans (one for 1-10%, the other for 10-100% of D/P), extending orifice accuracy to within 1% over a 10:1 flow range. Furthermore, it is possible to include in this accuracy statement not only hysteresis, rangeability, and linearity effects, but also drift, temperature, humidity, vibration, over-range, and power supply variations effects.
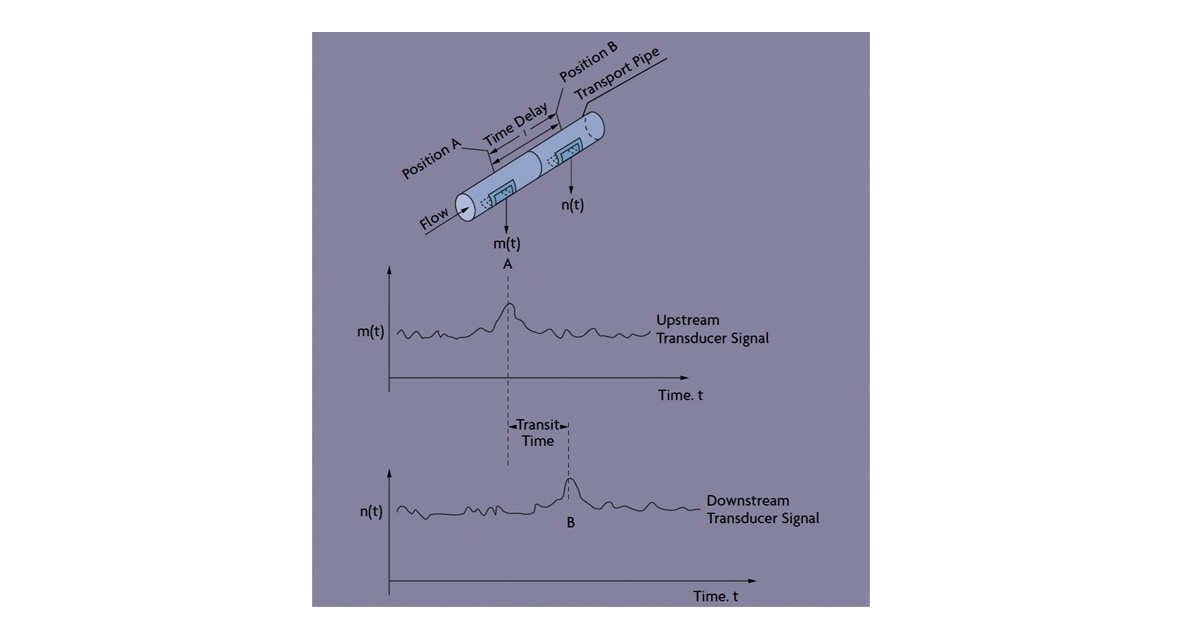 Figure 6: The Ultrasonic Transit-Time Flow Meter
With the development of superchips, the design of the universal flow meter also has become feasible. It is now possible to replace dye-tagging or chemical-tracing meters (which measured flow velocity by dividing the distance between two points by the transit time of the trace), with traceless cross-correlation flow meters (Figure 6). This is an elegant flow meter because it requires no physical change in the process – not even penetration of the pipe. The measurement is based on memorizing the noise pattern in any externally detectable process variable, and, as the fluid travels from point A to point B, noting its transit time.

